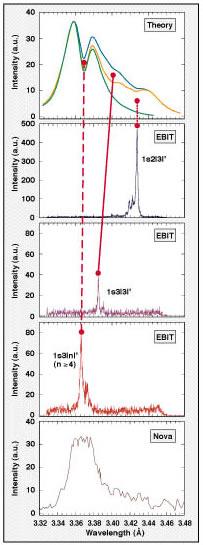
He-beta (n=3 ® n=1) transition are used in inertial confinement fusion (ICF) research as a diagnostic for density and electron temperature. In Figure 1, a measurement of the He-beta transition in Ar16+ made on the NOVA laser is shown in (a). A theoretical prediction of the line emission is shown in (b). Note that theory predicts a dip in the middle of the line. This dip is not observed. The reason why the dip is not observed is not clear.
We have made careful measurements of the satellite contributions to the He-beta line of Ar16+ using EBIT. First, we measured the 1s2l3l’ satellites, shown in (c). These are included in the model predictions and lead to a long-wavelength shoulder that is sensitive to the electron temperature. Second, we measured the 1s3l3l’ satellites, shown in (d). There are also included in the model, further raising the shoulder and increasing the intensity of the long-wavelength side of the He-beta line. Finally, we measured the 1s3lnl’ satellites (with n³ 4), shown in (e). The satellites are situated exactly where the dip is predicted. Their intensity is 3–4 times larger than the intensity of the 1s3l3l’ satellites. These satellites are missing from the model predictions. Our measurements suggest that this might be the reason for the disagreement between the predictions and the NOVA measurement.
The determination of charge state distributions of ICF plasmas being aided by work at EBIT. EBIT work on charge state distributions has since continued using the XRS and ECS microcalorimeters.
Gold Ion Charge Balance Measurements in EBIT
Many ICF experiments utilize radiation from intense laser heated gold hohlraums to drive the implosions [1,2,3]. In order to understand the plasma, it is important to know the charge state distribution (CSD) of the gold (Au, element 79) ions. Present computer models are not capable of correctly predicting the CSD in the hohlraum blow-off plasma [4]. Therefore, definitive measurements are needed to help guide the implementation of atomic physics in these models for non-local thermodynamic equilibrium (NLTE) plasmas. Such experiments need to be performed at various plasma conditions in order to isolate and study specific atomic physics processes.
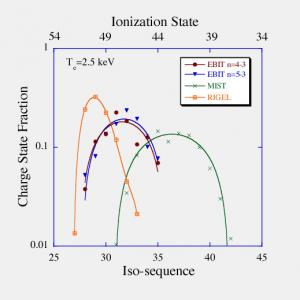
We have performed several experiments in EBIT to measure the charge state distribution of Au in coronal conditions. We have the capability to create an experimentally simulated thermal electron distribution. Both the electron beam energy and anode voltages were swept to map out a Maxwell-Boltzmann electron distribution in time with a given temperature by using the techniques described in Ref. [8]. In Figure 2, we present a typical charge state distribution for a plasma with Te = 2.50±0.04 keV and ne ~ 1012 cm-3. The charge state distribution was determined by fitting measured spectra to synthetic spectra generated by the Hebrew University Lawrence Livermore Atomic Code (HULLAC) [9] The x-ray emission spectrum consisted of pairs of nf5/2 – 3d3/2 and nf7/2 – 3d5/2 lines and emit between 2400 to 2600 eV for n=4 and between 3100 and 3500 eV for n=5. Each of the charge balances was inferred from one of the spectral regions and yielded very consistent results. Also shown in the figure are the charge state distribution simulations from two modeling codes RIGEL[7] and the Multiple Ionization State Transport (MIST) Code[10] which equally bracket the experiment. Both codes have been run with ne = 1x1012 cm-3 and Te = 2.5 keV. Averaging over our charge state distribution measurements, we find the average charge state to be 46.8±0.75. This is in disagreement with the predicted average charge state of 49.5 from the RIGEL and the average charge state of 42.7 from the MIST code. Despite the simplification afforded by the coronal plasma, the available modeling codes do not adequately reproduce the charge state distribution in EBIT. This indicates that ionization balance calculations do not yet have the predictive power necessary to describe the ionization equilibrium of an arbitrary plasma.
References
- H. R. Griem, Phys. Fluids B 4, 2346 (1992).
- M. Fajardo, Phys. Rev. Lett. 86, 1231 (2001).
- C. Y. Cote, J. C. Kieffer and O. Peyrusse, Phys. Rev. E 56, 992 (1997).
- R. W. Lee, J. K. Nash, and Y. Ralchenko, J. Quant. Spect. Rad. Transf. 58, 737 (1997).
- M. E. Foord et al., Phys. Rev. Lett. 85, 992 (2000).
- S. H. Glenzer et al., Phys. Rev. Lett. 87, 045002 (2001).
- B. G. Wilson et al., Radiative Properties of Hot Dense Matter, edited by W. Goldstein, C. Hooper, J. Gauthier, J. Seely, and R. Lee (World Scientific, Singapore, 1991).
- D. W. Savin, et al., Rev. Sci. Instrum. 71, 3362 (2000).
- A. Bar-Shalom, M. Klapisch, and J. Oreg, J. of Quant. Spect. and Rad. Transf. 71, 169 (2001).
- R. A. Hulse, Nuclear Technology Fusion 3, 259 (Mar 1983).
Ion Charge Balance Measurements in EBIT Using a Microcalorimeter
Many inertial confinement fusion (ICF) experiments utilize radiation from intense laser heated gold hohlraums or halfraums (half open hohlraums) to drive the implosions. In order to find out how much energy has been deposited in the plasma, one wants to know the temperature that has been reached in the plasma. At a higher electron temperature, the ions are expected to be more highly ionized. A (conceptually) simple thermometer would indicate the ion charge states reached, and suitable theoretical modeling then links the charge state distribution (CSD) to the temperature.
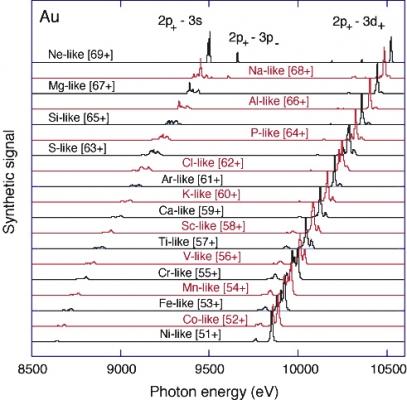
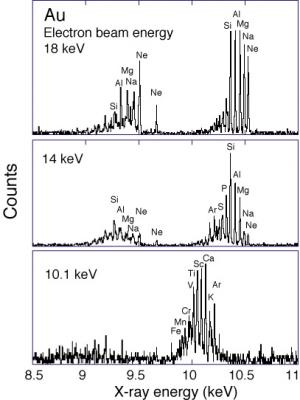
Laser-produced plasmas (of high electron density) live only for very brief periods (nanoseconds - a few billionths of a second), and a single shot of an X-ray framing camera has to be enough to yield a spectrum that can then be compared to observations from an EBIT. The corresponding EBIT work (at low electron density) has taken a number of days of observations using a microcalorimeter [1]. The electron beam energy determines the upper limit of ion species that can be produced by ionization in the trap. It turns out that the X-ray spectra resemble a picket fence in which Ne-like ions (only 10 electrons remaining of the 79 electrons of gold atoms) (Au, element 79) stand out, and ions with increasing numbers of electrons can be clearly distinguished.
Our spectral modeling calculations for ions with up to 26 electron (Fe-like) enable the identification of the X-ray lines, indicate the necessary spectral resolving power of ICF observations, and also show the limits of the technique when atomic structure results in multiple peaks that coincide with the major peaks from neighboring charge state ions.
Reference
- G. V. Brown, S. B. Hansen, E. Träbert, P. Beiersdorfer, K. Widmann, H. Chen, H. K. Chung, J. H. T. Clementson, M. F. Gu, D. B. Thorn, Phys. Rev. E 77, 066406 (2008)


